(
Back to the Assignments page)
EditTask Overview
In this assignment, you are going to mine knowledge from a realworld data set. The whole procedure is depicted step-by-step as the flowchart below. Click links aside the chart to find detailed instructions.
CAUTION: DO YOUR JOB ALONE. VIOLATION RECEIVES PUNISHMENT.
The author holds the copyright of the report. The report, unless agreed by the author, will not be disclosed to any third party.
EditData set description and download
The story: We are carrying many sensors every day, such as the acceleration sensors installed in mobile phones. By using the data readings from these sensors, it is possible to infer the activities of users, so that convenience would be create automatically. In this assignment, you are given a data set collected from a set of sensors, and are going to predict the user activities from the data readings.
Download:
There are 5 data sets for training A, B, C, D, E, each is the data collected from a person. Each ZIP file contains a .feature file and a .label file, they are all text files.
Traindata-A
Traindata-B
Traindata-C
Traindata-D
Traindata-E
There are 3 data sets for testing, X, Y, Z, each is the data collected from a person depart from the training persons. The ZIP file contains 3 .feature file but no .label files
Testdata-XYZ
File Description:
All files are text file. You can open them by any text editor. Below is an example of the .feature file and .label file.
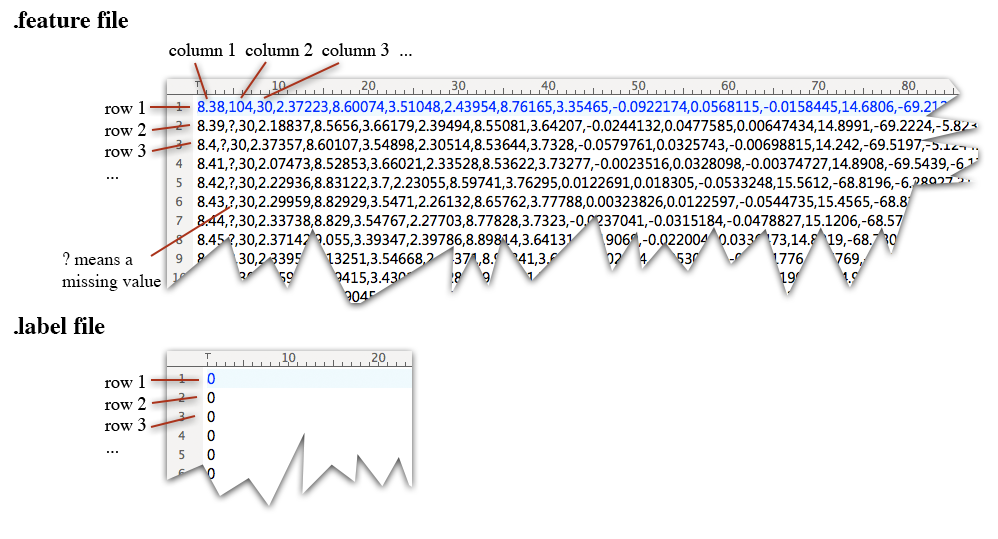
• In a .feature file, there are 41 columns (or called features). The 1st column is the time stamp of the record. The 2nd column is the heart beat rate. 3rd-15th columns, 16th-28th columns, and 29th-41st columns are the signals respectively of three body integrated sensors. The features for each integrated sensor is composited by 1 feature of temperature data, 3 features of type-I 3D-acceleration data, 3 features of type-II 3D-acceleration data, 3 features of 3D-gyroscope data, 3 features of 3D-magnetometer data.
• In a .label file, each row is a class label of the corresponding features record of the .feature file. So that .label file has the same number of rows as the .feature file. The class id ranges from 0 to 24, where 0 means no activity.
Your task is to build a model from the A, B, C, D, E training data, and to predict the classes of the X, Y, Z test data. It is up to you to decide use all or some of the training data. Your predictions of the classes of the test data should be stored in "X.label", "Y.label", and "Z.label" files, which will be included in your submission of this assignment.
EditAbout algorithm implementations and output
Algorithm implimentation: It is up to you to choose any programming language and implement any learning algorithm. You are also encouraged to analyze the difficulties in this prediction task, find appropriate learning algorithm or invent your own algorithms. Problem analysis and innovative thoughts are helpful to get you high score.
Output of your algorithm:
Your algorithm should output 3 files, namely, "X.label", "Y.label", and "Z.label", each contains your predicted classes of the X, Y, Z data, respectively. In the output file, each line contains a predicted class that corresponds to the .feature file. This is similar to that between "A.feature" and "A.label" files.
Evaluation of the output:
For an activity a (i.e., class 1~24), comparing your prediction and the true class, we can have four quantities:
- Precision: in the instances you predicted as the activity, how many of them are the true activity;
- Recall: in all the true activity instances, how many of them are corrected predicted as the activity;
The F1-measure of the activity is then calculated as F1(a) = 2*Precision(a)*Recall(a)/( Precision(a)+Recall(a) ), which is the harmonic mean of precision and recall.
The overall evaluation score of your output is the sum of F1-measure over all activities, i.e., F1(1) + F1(2) + ... + F1(24)
EditHow to test your output
After generating your X.label, Y.label and Z.label files, please open the following web site:
http://lamda.nju.edu.cn/contest/dm13
and upload your files.
In the above web site, you will be able to compare your prediction performance (on X.label file) with those of your classmates.
Please use your student ID, the scores from Y.label and Z.label will be counted into your final score of the assignment.
EditRequirements of your report
What to write: Your report includes
a)
your understanding of the problem;
b) the used approach with its backgrounds;
c) full technical details of the algorithm you use, including pseudocode of your algorithm;
d) details of the produced prediction model;
e) (optional) discussion on what insights can be gained in terms of identifying current 2G customers with the potential to switch to 3G.
How to write: Please use this MSWord template to write your report in Chinese. At the finish, please transform your MSWord file to PDF file for submission.
Must NOT plagiarize: You should be careful on writing your report. Whenever you are using words and works of others, citations should be made clear such that one can tell which part is actually yours. Details about how to identify a plagiarism can be found in "How to Handle Plagiarism: New Guidelines".
EditHow to submit
First, check your files:
a) 'output.txt' file;
b) 'report.pdf' file -- your report;
c) source files of your algorithms.
Note that files 'output.txt' and 'report.pdf' should not in other names.
Pack all your files into a single compressed file (compress in ZIP, RAR, 7Z, or TAR formats). Name the compressed file using your student ID, e.g., 'MG0733001.ZIP'.
Upload your compressed file to FTP: (please use FTP software to upload, do not use Windows Explorer or IE)
ftp://lamda.nju.edu.cn/dm/assignment2/
username: dm13
password: dm13
EditHow is your work evaluated
Evaluation of your predictions: The sum F1-measures on the Y, Z data sets will be your prediction score.
Evaluation of your report: A report with a fully explained idea, technique details, and valid experiments will receive a good score.
Evaluation of your source codes: fake and plagiarized source codes receives low scores.
No score will be given to a plagiarism or fake experiment.
(You should submit your complete source codes. When I feel anything suspicious in the report,
I will run your codes.)
EditAbout the Presentation
Eight randomly drawn students are going to give presentations on their work, which will address
- What is your approach to mining?
- How is the approach evaluated?
- What is the evaluation result?